How to Read Candlestick Charts
Candlestick charts are one of the most powerful tools for analyzing price movements in the stock market. They provide a visual representation of price action, making it easier to identify trends, reversals, and potential trading opportunities. In this guide, we will break down everything you must know about candlestick charts, including their components, common patterns, and how to use them in your trading strategy.
What Are Candlestick Charts?
Candlestick charts originated in Japan over 300 years ago and were used to analyze the price of rice contracts. Today, traders widely use them to analyze stocks, forex, cryptocurrencies, and other financial instruments. Each candlestick represents the price movement of an asset over a specific period, such as 1 minute, 1 hour, 1 day, or 1 week.
Key Components of a Candlestick
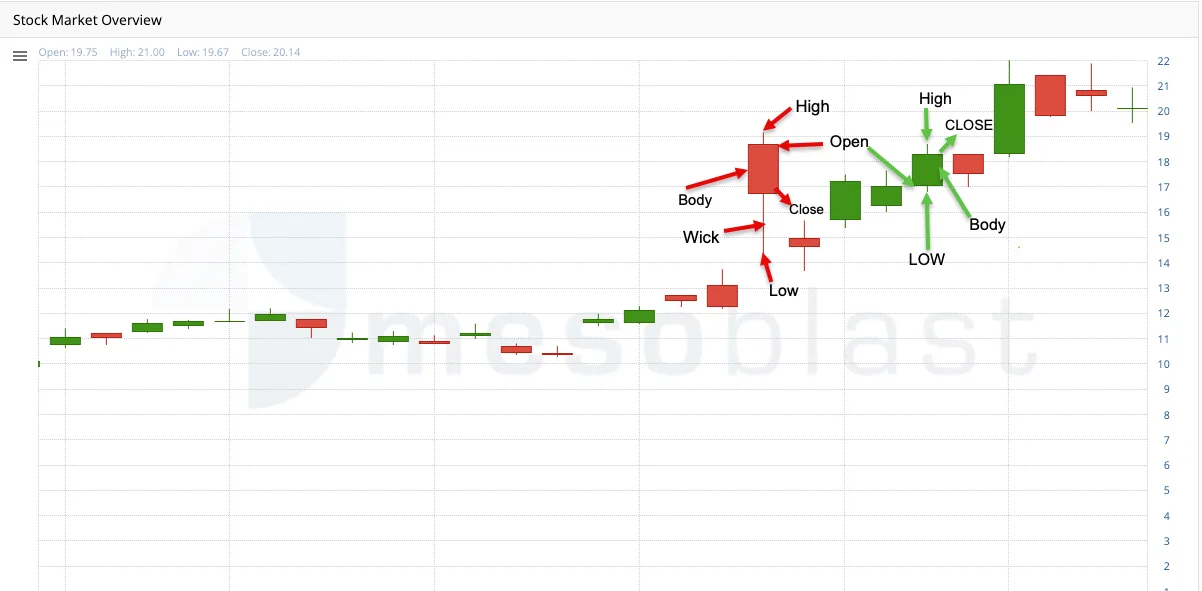
Each candlestick has four main components:
Open: The price at which the asset opened during the period.
Close: The price at which the asset closed during the time.
High: The highest price reached during the period.
Low: The lowest price reached during the period.
These components are represented visually as follows:
Body: The rectangular area between the open and closed prices. The body is filled (red or black) if the close is lower than the open (bearish) and empty or green/white if the close is higher than the open (bullish).
Wicks (or Shadows): The thin lines above and below the body, represent the high and low prices.
Why Candlestick Charts Are Useful
Candlestick charts provide a wealth of information in a single visual:
They show the direction of price movement (up or down).
They indicate the strength of buying or selling pressure.
They help identify key levels of support and resistance.
They reveal patterns that can signal potential reversals or continuations.
How to Read Candlestick Charts
Step 1: Understand the Basics
Before diving into patterns, it’s important to understand the basic structure of a candlestick. Here’s a breakdown:
Bullish Candle: The close is higher than the open. The body is typically green or white.
Bearish Candle: The close is lower than the open. The body is typically red or black.
Wicks: The length of the wicks shows the range of price movement during the period. Long wicks indicate volatility or rejection of higher/lower prices.
Step 2: Identify Trends
Candlestick charts make it easy to spot trends:
Uptrend: A series of higher highs and higher lows, with predominantly green candles.
Downtrend: A series of lower highs and lower lows, with predominantly red candles.
Sideways/Ranging Market: Candlesticks move within a horizontal range, with no clear trend.
Step 3: Look for Candlestick Patterns
Candlestick patterns are formations of one or more candles that signal potential reversals or continuations. These patterns are divided into two categories:
Reversal Patterns: Indicate a potential change in the direction of the trend.
Continuation Patterns: Suggest the current trend is likely to continue.
Common Candlestick Patterns
1. Single-Candle Patterns
These patterns consist of a single candlestick and are often used to identify potential reversals or indecisions in the market.
Doji
Description: A Doji has a small body, indicating that the open and close prices are nearly equal. The wicks can be long or short.
What It Means: A Doji signals indecision in the market. It often appears at key support or resistance levels and can indicate a potential reversal.

Hammer
Description: A Hammer has a small body and a long lower wick, with little to no upper wick. It forms after a downtrend.
What It Means: A Hammer signals a potential bullish reversal. The long lower wick shows sellers pushed the price down, but buyers regained control by the close.

Shooting Star
Description: A Shooting Star has a small body and a long upper wick, with little to no lower wick. It forms after an uptrend.
What It Means: A Shooting Star signals a potential bearish reversal. The long upper wick shows buyers pushed the price up, but sellers regained control by the close.

2. Multi-Candle Patterns
These patterns consist of two or more candlesticks and provide stronger signals than single-candle patterns.
Engulfing Patterns
Bearish Engulfing: A small bullish candle is followed by a larger bearish candle that completely engulfs the previous candle.
What It Means: Signals a potential bearish reversal.
Bullish Engulfing: A small bearish candle is followed by a large bullish candle that completely engulfs the previous candle.
What It Means: Signals a potential bullish reversal.

Morning Star and Evening Star
Morning Star: A three-candle pattern that forms after a downtrend. It consists of a long bearish candle, a small indecision candle (like a Doji), and a long bullish candle.
What It Means: Signals a potential bullish reversal.

Evening Star: A three-candle pattern that forms after an uptrend. It consists of a long bullish candle, a small indecision candle (like a Doji), and a long bearish candle.
What It Means: Signals a potential bearish reversal.

3. Continuation Patterns
These patterns suggest that the current trend is likely to continue.
Bullish and Bearish Flags
Description: Flags are small rectangular patterns that form after a sharp price movement (the flagpole). The flag slopes against the trend.
What It Means: Flags indicate a brief consolidation before the trend resumes.


Triangles
Description: Triangles are formed by converging trendlines and can be symmetrical, ascending, or descending.
What It Means: Triangles indicate consolidation and often lead to a breakout in the direction of the trend.

How to Use Candlestick Charts
Candlestick patterns are most effective when used in conjunction with other technical indicators, such as:
Moving Averages: To confirm the trend direction.
Relative Strength Index (RSI): To identify overbought or oversold conditions.
Volume: To confirm the strength of a pattern.
Step 2: Practice Risk Management
Always use stop-loss orders and proper position sizing to manage risk. Candlestick patterns are not foolproof, and false signals can occur.
Step 3: Backtest and Practice
Before trading with real money, practice identifying candlestick patterns on historical data. This will help you build confidence and improve your accuracy.
Final Thoughts
Candlestick charts are an essential tool for traders of all experience levels. By understanding the components of a candlestick and recognizing common patterns, you can gain valuable insights into market sentiment and make more informed trading decisions. Remember to combine candlestick analysis with other tools and practice sound risk management. Click here to review how to read stock charts.